StatisticsFree Tool

Normal Distribution Calculator

Provided byOmni Calculatoromnicalculator.com

Effortlessly calculate probabilities with our bell curve calculator, a perfect tool for any probability distribution ...
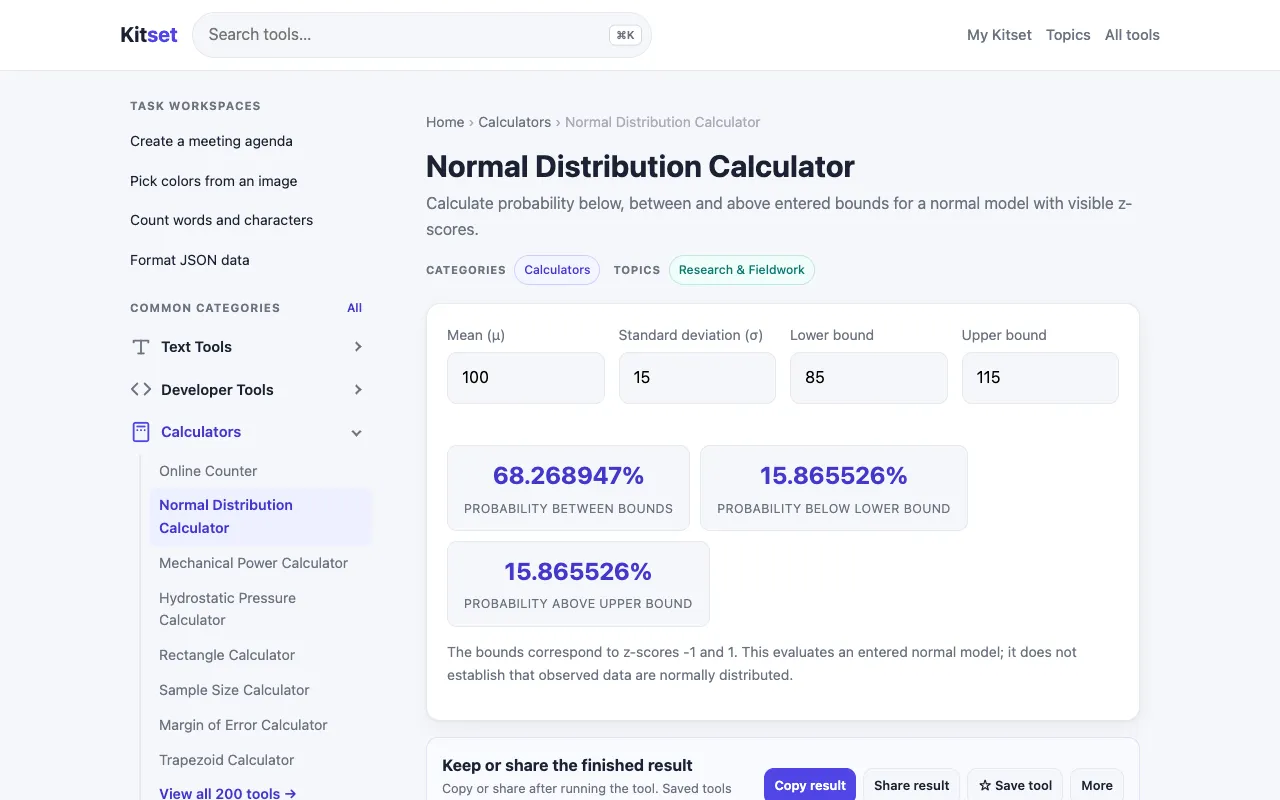
Screenshot of Normal Distribution Calculator on Omni Calculator
omnicalculator.comOpen the live tool →
About this tool

What Normal Distribution Calculator does

The Normal Distribution Calculator on Omni Calculator lets users compute probabilities associated with any normal distribution by entering the mean, standard deviation, and a raw score value X. It outputs the Z-score, the probability that a value is less than X (P(x < X)), and the probability that a value is greater than X (P(x > X)). The tool also supports calculating the probability of a value falling within a custom range by entering two X values. Beyond the calculator, the site offers a hub of statistics resources, including articles on sampling, confidence intervals, and statistical concepts, providing educational context alongside the computation.

Step by step

How to use the Omni Calculator Normal Distribution Calculator

  1. 1

    Enter the mean (μ) of the distribution

  2. 2

    Enter the standard deviation (σ)

  3. 3

    Enter the raw score value X to find probabilities

  4. 4

    View the calculated Z-score and the resulting P(x < X) and P(x > X) outputs

  5. 5

    Input a second X value to calculate the probability of a value falling between two points

Is it right for you

Best for

Students, educators, and analysts who need quick, reliable probability calculations for normal distributions without manual Z-table lookups or statistical software.

Limitations

  • Results are estimates based on the normal distribution model
  • Requires accurate input of mean and standard deviation for valid results
  • Primarily designed for single-value or range probability queries, not complex multivariate analysis
Questions

Normal Distribution Calculator FAQ

How do I find the probability that a value is greater than a specific score?
Enter the mean, standard deviation, and the raw score value X into the calculator. The tool will output P(x > X), which represents the area under the normal curve to the right of X.
Can this calculator find the probability of a value falling between two scores?
Yes, by entering a second X value (X₂), the calculator determines the probability that the variable falls within the range from the first X to X₂.
What is a Z-score and how is it used here?
The Z-score measures how many standard deviations a raw score X is from the mean. This calculator automatically computes the Z-score, which underpins the probability calculations for P(x < X) and P(x > X).
Does the site provide explanations for the statistics concepts used?
Yes, the page includes articles explaining normal distribution terms, the cumulative distribution function formula, and real-world examples, serving as a learning resource alongside the calculator.
Keep Exploring

Similar tools

Based on shared tags